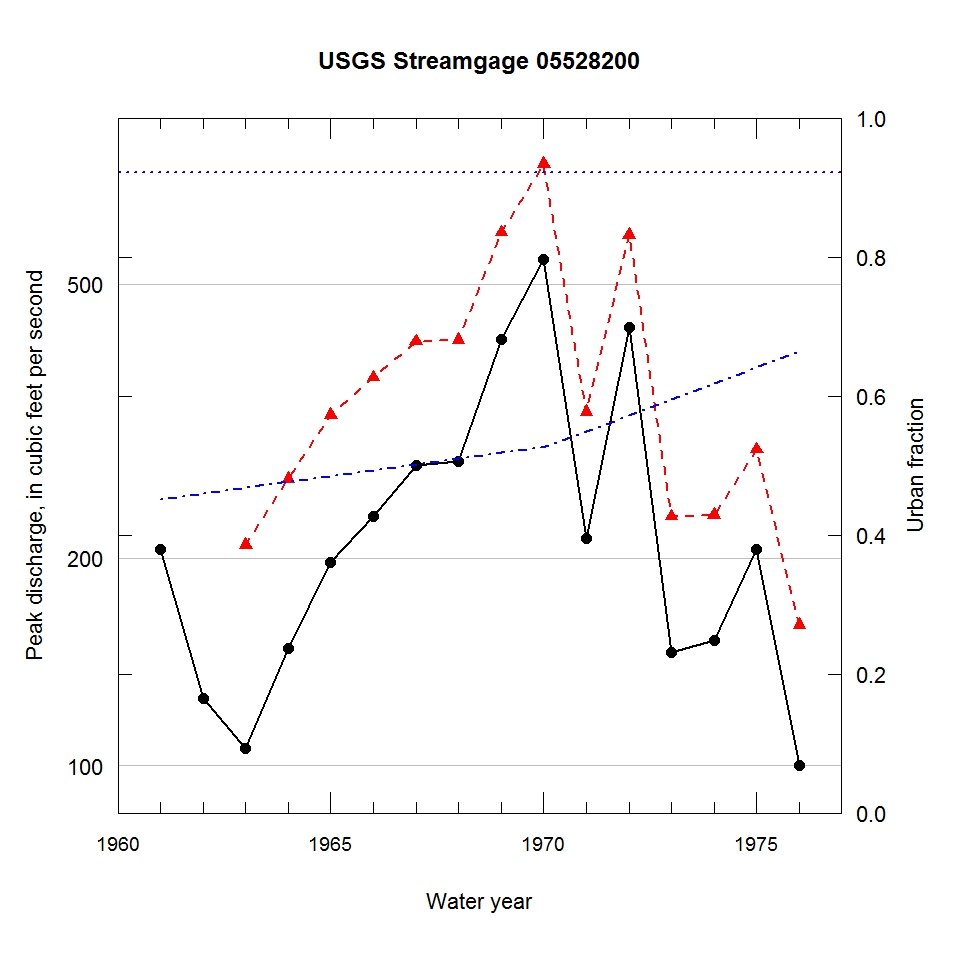
Observed and urbanization-adjusted annual maximum peak discharge and associated urban fraction and precipitation values at USGS streamgage:
05528200 HAWTHORN DRAINAGE DITCH NEAR MUNDELEIN, IL


| Water year | Segment | Discharge code | Cumulative reservoir storage (acre-feet) | Urban fraction | Precipitation (inches) | Observed peak discharge (ft3/s) | Adjusted peak discharge (ft3/s) | Exceedance probability |
| 1961 | 0 | -- | 910 | 0.452 | 1.970 | 206 | -- | -- |
| 1962 | 0 | -- | 1404 | 0.460 | 0.258 | 125 | -- | -- |
| 1963 | 1 | -- | 1404 | 0.468 | 1.264 | 106 | 209 | 0.880 |
| 1964 | 1 | -- | 1404 | 0.477 | 1.759 | 148 | 261 | 0.735 |
| 1965 | 1 | -- | 1404 | 0.485 | 0.563 | 197 | 323 | 0.532 |
| 1966 | 1 | -- | 1404 | 0.493 | 0.476 | 230 | 366 | 0.411 |
| 1967 | 1 | -- | 1404 | 0.502 | 1.284 | 273 | 413 | 0.276 |
| 1968 | 1 | -- | 1404 | 0.510 | 1.195 | 277 | 415 | 0.271 |
| 1969 | 1 | -- | 1404 | 0.518 | 1.362 | 416 | 595 | 0.079 |
| 1970 | 1 | -- | 1404 | 0.527 | 1.525 | 543 | 748 | 0.034 |
| 1971 | 1 | -- | 1404 | 0.550 | 0.417 | 214 | 326 | 0.524 |
| 1972 | 1 | -- | 1404 | 0.572 | 1.203 | 433 | 590 | 0.081 |
| 1973 | 1 | -- | 1404 | 0.595 | 1.421 | 146 | 230 | 0.825 |
| 1974 | 1 | -- | 1404 | 0.618 | 0.641 | 152 | 231 | 0.821 |
| 1975 | 1 | 2 | 1404 | 0.641 | 0.784 | 206 | 288 | 0.645 |
| 1976 | 1 | -- | 1404 | 0.664 | 1.272 | 100 | 160 | 0.956 |

